駅の位置情報から路線の経路を推測する
概要
駅の位置情報から、当該路線がどのような順序で走っているかを推測してみる。
前提条件として、各路線の駅の一覧、各駅の緯度と経度がわかっているが、その路線をどのような順序で列車が通過していくかはわかっていないものとする。また、路線の始点と終点はあらかじめ与えられるものとする。
すべての駅を通過し、且つその経路が最短になるルートを探索すれば、おそらくそれっぽいルートが選択できると思われる。経路選択の話はあまりよく知らないのだけど、ダイクストラ法のような最短経路問題ではなく、巡回セールスマン問題(traveling salesman problem)になるのだろうか。山手線の場合はハミルトン閉路問題になりそう。
駅データのダウンロード
下記サイトから拝借。無料会員登録でダウンロード可能。有料版もあるけど無料版だけでも十分なデータが揃ってる。
駅データの読込
import pandas as pd
stations = pd.read_csv('station20150414free.csv')
lines = pd.read_csv('line20150414free.csv')
データの内容例。
stations.head(3)
   station_cd  station_g_cd station_name  station_name_k  station_name_r  \
0     1110101       1110101           函館             NaN             NaN
1     1110102       1110102          五稜郭             NaN             NaN
2     1110103       1110103           桔梗             NaN             NaN

   line_cd  pref_cd      post               add         lon        lat  \
0    11101        1  040-0063    北海道函館市若松町12-13  140.726413  41.773709
1    11101        1  041-0813           函館市亀田本町  140.733539  41.803557
2    11101        1  041-1210  北海道函館市桔梗3丁目41-36  140.722952  41.846457

     open_ymd close_ymd  e_status   e_sort
0  1902-12-10       NaN         0  1110101
1         NaN       NaN         0  1110102
2  1902-12-10       NaN         0  1110103
lines.head(3)
   line_cd  company_cd line_name   line_name_k line_name_h line_color_c  \
0     1001           3     中央新幹線   チュウオウシンカンセン       中央新幹線          NaN
1     1002           3    東海道新幹線  トウカイドウシンカンセン      東海道新幹線          NaN
2     1003           4     山陽新幹線    サンヨウシンカンセン       山陽新幹線          NaN

  line_color_t  line_type         lon        lat  zoom  e_status  e_sort
0          NaN        NaN  137.493896  35.411438     8         1    1001
1          NaN        NaN  137.721489  35.144122     7         0    1002
2          NaN        NaN  133.147896  34.419338     7         0    1003
今回は駅名、路線名、緯度、軽度の4項目が欲しいので、マージして取得。
stations = stations[['station_cd', 'station_name', 'line_cd', 'lon', 'lat']].merge(lines[['line_cd', 'line_name']])
取得結果の例として大江戸線の駅3つを表示。
stations[stations.line_name.str.contains('大江戸線')].head(3)
      station_cd station_name  line_cd         lon        lat line_name
7557     9930101          都庁前    99301  139.692570  35.690551    都営大江戸線
7558     9930102         新宿西口    99301  139.699155  35.693315    都営大江戸線
7559     9930103          東新宿    99301  139.707549  35.697920    都営大江戸線
これで各路線ごとの駅の緯度経度が取得できた。
駅の緯度経度で散布図
lon(経度)をX、lat(緯度)をYにして散布図を書くと、駅の位置でplotされる。
日本全体の駅の位置。
stations.plot(kind='scatter', x='lon', y='lat', alpha=0.1)
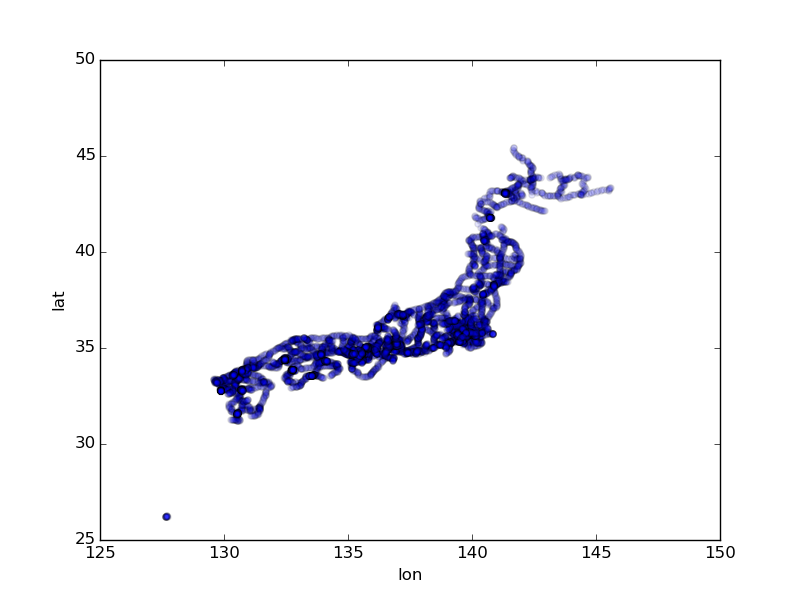
駅の点を出すだけで日本列島の形が浮かび上がってくる。沖縄も含めてほぼ日本中で走っている模様。
尚、緯度軽度1度あたりの距離は同じではなく、東京周辺では緯度1度に対して111km、経度1度に対して91kmくらいになるので、上記の地図は実際の距離と比べると横長になっている。
路線ごとの表示もしてみる。
東武東上線(青)、西武池袋線(赤)、JR埼京線(緑)、西武新宿線(オレンジ)でまとめて表示。
ax = stations[stations.line_name == '東武東上線'].plot(kind='scatter', x='lon', y='lat', color='blue')
ax = stations[stations.line_name == '西武池袋線'].plot(kind='scatter', x='lon', y='lat', color='red', ax=ax)
ax = stations[stations.line_name == 'JR埼京線'].plot(kind='scatter', x='lon', y='lat', color='green', ax=ax)
ax = stations[stations.line_name == '西武新宿線'].plot(kind='scatter', x='lon', y='lat', color='orange', ax=ax)
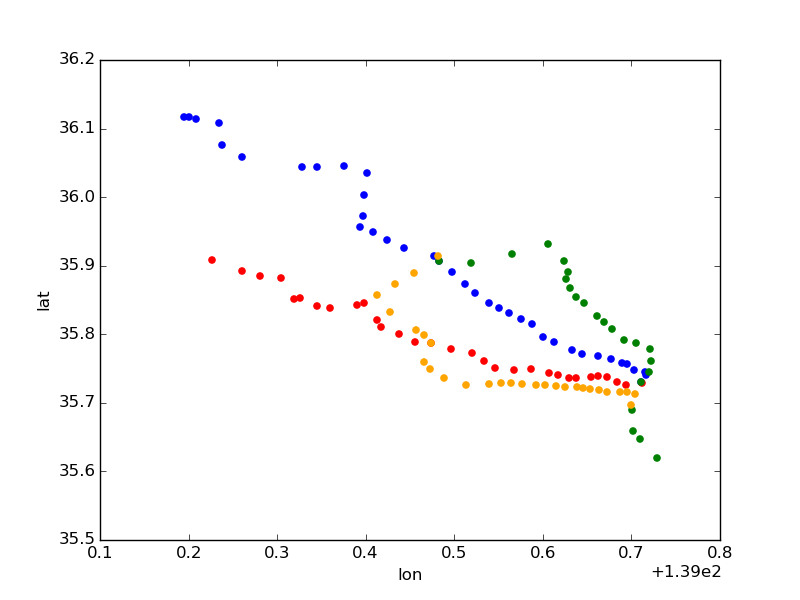
池袋(右下の方)を始点に埼玉にむかって伸びているのが見てわかる。
解けない路線 - 枝分かれ
解答を正しく推測できないであろう路線があるので、それらは最初から対象に含めないものとする。丸ノ内線、大江戸線などが解けない路線になる。
例えば丸ノ内線は中野坂上から先で枝分かれしているので扱えない。
stations[stations.line_name == '東京メトロ丸ノ内線'].plot(kind='scatter', x='lon', y='lat')
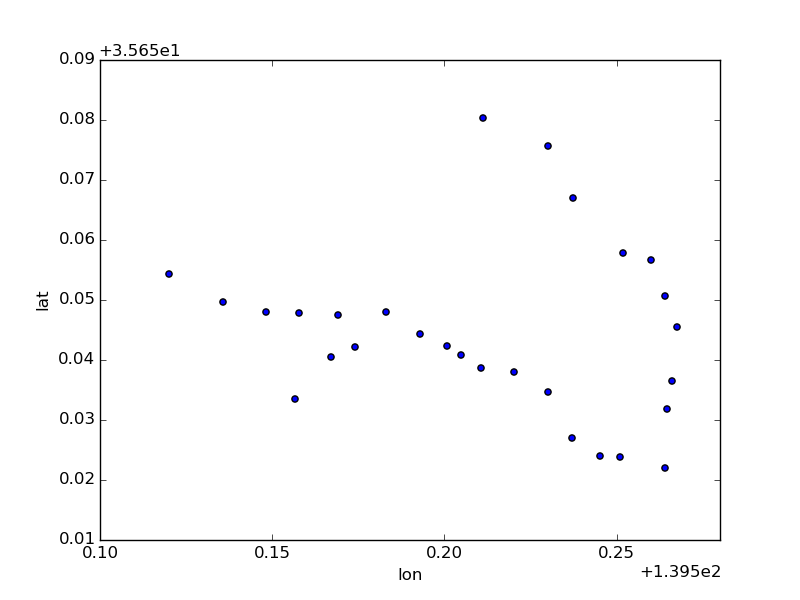
都営大江戸線は都庁前からスタートして1周する経路と、練馬方面へと進む経路の複合型になっている。
stations[stations.line_name == '都営大江戸線'].plot(kind='scatter', x='lon', y='lat')
枝分かれする路線を推測するというのは難しい。というか無理。
類似の路線としてユーカリが丘線、神戸新交通ポートアイランド線などがある。
解ける路線 - 環状
山手線のような環状路線は始点を指定した上で対象に含める。山手線の他に、名古屋市営地下鉄名城線、JR大阪環状線などがそれにあたる。
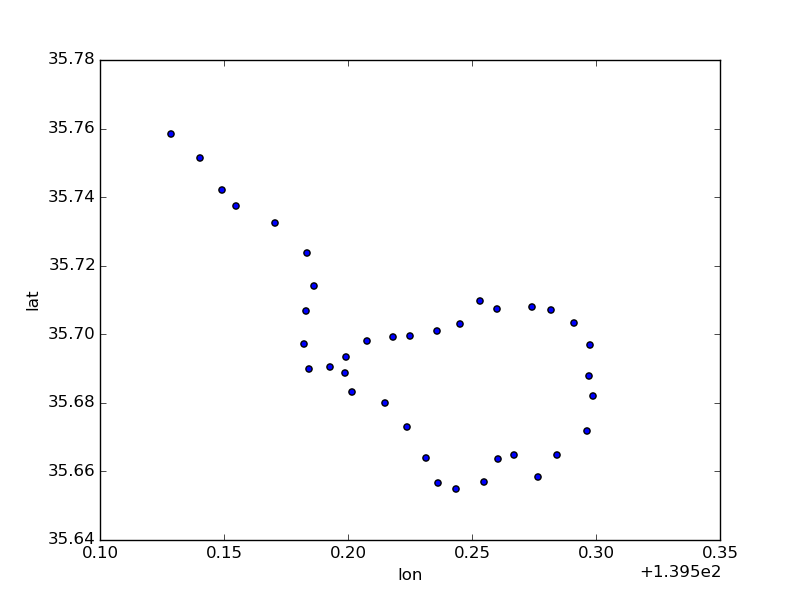
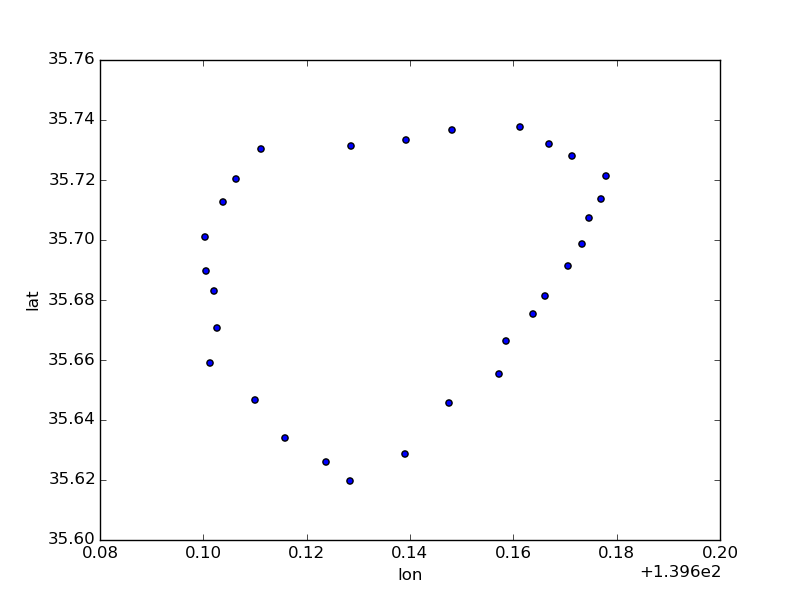
下記は山手線の位置情報。
stations[stations.line_name == 'JR山手線'].plot(kind='scatter', x='lon', y='lat')
総当りで京急大師線の経路を解く
巡回セールスマン問題はNP困難、つまりこれといって効率の良い解き方が存在しないようだ。
パターン数はnの階乗になるのでので、京急大師線(7駅)くらいの問題であれば5040パターン程度と計算機にとっては大したことはない量になる。
stations[stations.line_name == '京急大師線'].plot(kind='scatter', x='lon', y='lat')
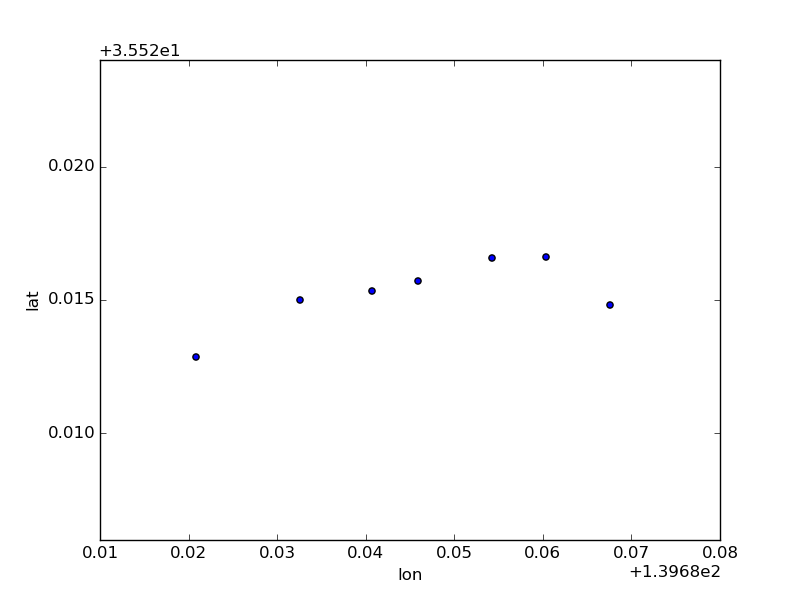
単純に全駅間でユークリッド距離を取って、最短になる経路を探してみる。
とりあえずデータを読み込んで各駅間の距離を出すところまで。
import pandas as pd, numpy as np
stations = pd.read_csv('station20150414free.csv')
lines = pd.read_csv('line20150414free.csv')
stations = stations[['station_cd', 'station_name', 'line_cd', 'lon', 'lat']].merge(lines[['line_cd', 'line_name']])

# dummyフラグを用意して、これを元にJOINすることで全組み合わせ(7 * 6 = 42パターン)を出す
stations['dummy'] = 1
taishi_sen = stations[stations.line_name == '京急大師線']
# index振り直し
taishi_sen = taishi_sen.reset_index().drop('index', axis=1)
# 7×7のパターン生成
distances = taishi_sen.merge(taishi_sen[['dummy', 'station_name', 'lat', 'lon']], on='dummy')
len(distances)
  #=> 49
# 同一駅同士の距離を消して7×6=42パターンに
distances = distances[distances.station_name_x != distances.station_name_y]
len(distances)
  #=> 42

# 距離を計算する
distances['distance'] = np.sqrt( (distances.lat_x - distances.lat_y) ** 2 + (distances.lon_x - distances.lon_y) ** 2 )

# indexにしておく
distances.set_index(['station_name_x', 'station_name_y'], inplace=True)
次に算出された距離で、全組み合わせの距離の合計を出してみる。始点と終点はわかっているものとするという条件だけど、今回くらいの数であればそれも必要なさそうなのでなしで実行。
7駅分のパターンなので7回再帰すれば出せるはず。
import copy
results = []
def next_station( selected ):
    if len(selected) >= len(taishi_sen):
        x = map( lambda i: distances.loc[selected[i], selected[i+1]].distance, range(0, len(selected) - 1))
        results.append( { 'route': selected, 'distance': sum(x) } )
    else:
        for station in filter(lambda s: not s in selected, taishi_sen.station_name):
            cp = copy.deepcopy(selected)
            cp.append(station)
            next_station( cp )

next_station( [] )
results[0:5]
  #=> [{'distance': 0.047168729572600709, 'route': ['京急川崎', '港町', '鈴木町', '川崎大師', '東門前', '産業道路', '小島新田']},
  #=>  {'distance': 0.054479761610325611, 'route': ['京急川崎', '港町', '鈴木町', '川崎大師', '東門前', '小島新田', '産業道路']},
  #=>  {'distance': 0.059211372668664053, 'route': ['京急川崎', '港町', '鈴木町', '川崎大師', '産業道路', '東門前', '小島新田']},
  #=>  {'distance': 0.060547141793998269, 'route': ['京急川崎', '港町', '鈴木町', '川崎大師', '産業道路', '小島新田', '東門前']},
  #=>  {'distance': 0.066396604207032056, 'route': ['京急川崎', '港町', '鈴木町', '川崎大師', '小島新田', '東門前', '産業道路']}]
もう少し綺麗な書き方があるような気がする。
とりあえずこれでsortして最短経路を求めてみる。
pd.DataFrame(results).sort('distance', inplace=False).head(5)

  #=>       distance                                   route
  #=> 5039  0.047169  [小島新田, 産業道路, 東門前, 川崎大師, 鈴木町, 港町, 京急川崎]
  #=> 0     0.047169  [京急川崎, 港町, 鈴木町, 川崎大師, 東門前, 産業道路, 小島新田]
  #=> 4319  0.054480  [産業道路, 小島新田, 東門前, 川崎大師, 鈴木町, 港町, 京急川崎]
  #=> 1     0.054480  [京急川崎, 港町, 鈴木町, 川崎大師, 東門前, 小島新田, 産業道路]
  #=> 5033  0.057772  [小島新田, 産業道路, 東門前, 鈴木町, 川崎大師, 港町, 京急川崎]
同一経路を逆順で行った場合も出てしまっていますが、算出された「京急川崎, 港町, 鈴木町, 川崎大師, 東門前, 産業道路, 小島新田」というルートは正解。
緯度・経度の距離を補正する
7駅程度であれば総当りも可能だけど、10駅になると360万パターンまで増え(このくらいまでなら総当りでもまあそこそこ現実的)、15駅になると1兆3千億パターンとだんだん手に負えなくなってくる。
今回のデータでは駅数は最大でJR東北本線(黒磯~利府・盛岡)の85件、10の2.8*10の652乗パターンになるそうだ。
ただ駅というのは基本的に最寄りの駅としか繋がらないので、枝狩りをちゃんとすればパターン数は現実的な数にまで抑えようがある。
最寄り駅を取るとなると今の緯度・経度のままではズレが問題に影響してくるので、latとlonをキロメートルに変換する。
精密にやるのは面倒なので、緯度は約111.1kmで固定とし、経度は111.320 * math.cos(lat / 180. * math.pi) とする。またlatとlonのminを起点とする。確かこれでそこまで大きくは変わらない程度の距離になるはず。
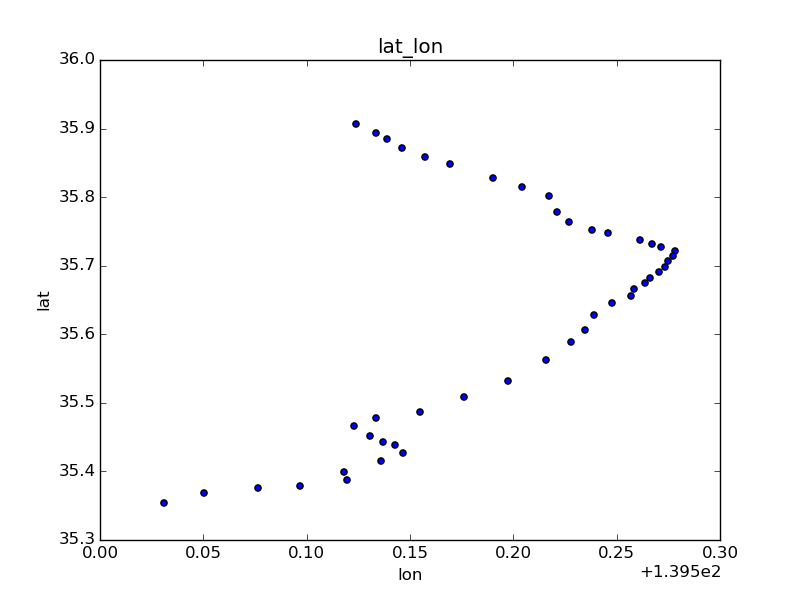
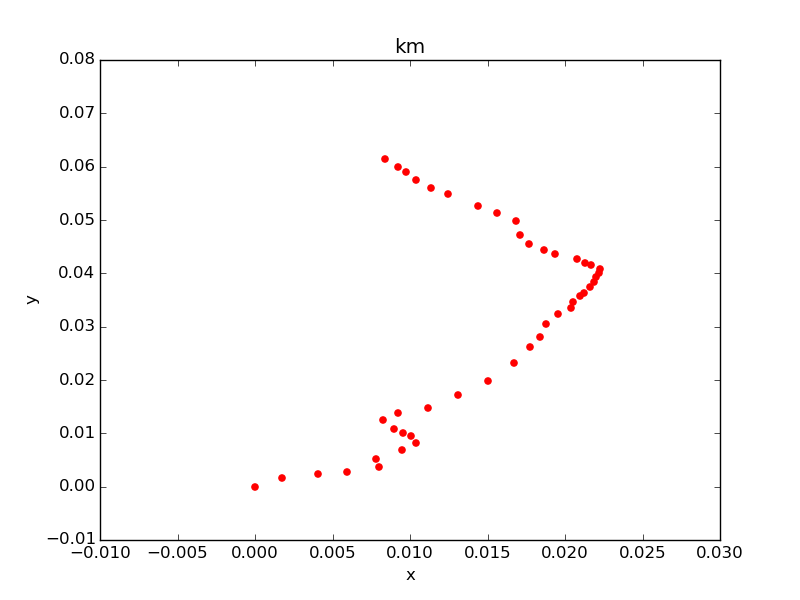
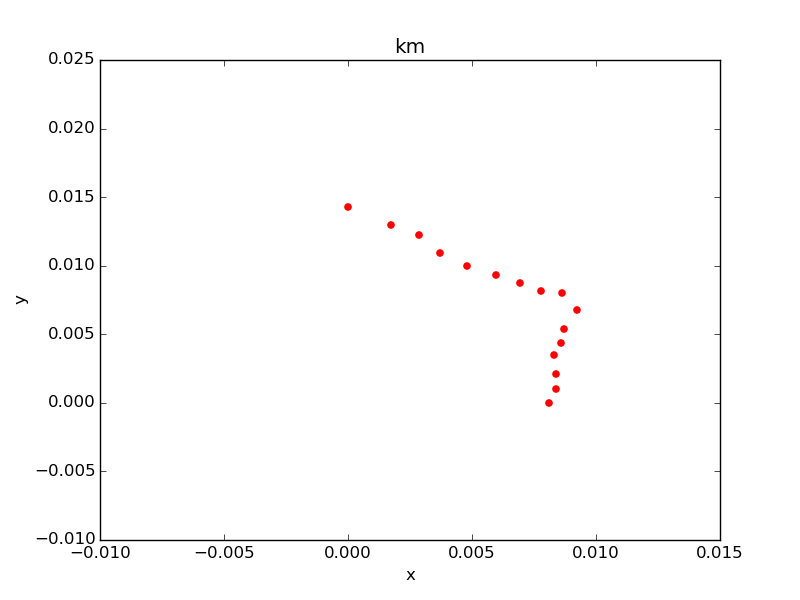
これで京浜東北線をplotしてみる。
target =  stations[stations.line_name == 'JR京浜東北線'].copy()
target['x'] = (target.lon - target.lon.min()) * (0.111 * np.cos(target.lat.mean() * np.pi / 180))
target['y'] = (target.lat - target.lat.min()) * 0.111
target.plot(kind='scatter', x='lon', y='lat', title='lat_lon')
target.plot(kind='scatter', x='x', y='y', title='km', color='red')
左側青がlat/lon使用。右側赤が距離に変換後。若干、縦長に矯正されている。
足切りしつつ副都心線を解く
わかりやすく解けそう例として、副都心線を扱う。下図のような形状をした路線。
全16駅。まず始発駅(渋谷駅とする)からK近傍法で最寄り2駅を取り、そこからまた次の2駅を取り、という操作を繰り返して経路パターンを作る。出来上がるパターンは最大で2の15乗(32768)になるので余裕で扱える。
# 副都心線のデータでlat/lonを距離に変換
target =  stations[stations.line_name == '東京メトロ副都心線'].copy().reset_index()
target['x'] = (target.lon - target.lon.min()) * (0.111 * np.cos(target.lat.mean() * np.pi / 180))
target['y'] = (target.lat - target.lat.min()) * 0.111

# k近傍法/ユークリッド距離で用意
from sklearn.neighbors import NearestNeighbors
nbrs = NearestNeighbors( n_neighbors=5, algorithm='kd_tree', metric='euclidean' ).fit( target[['x', 'y']].values )
distances, indices = nbrs.kneighbors( target[['x', 'y']].values )

import copy
results = []
def choose_station(routes):
    if len(routes['stations']) >= len(target):
        distance = sum( map(lambda x: routes['distance'], routes))
        results.append(routes)
    else:
        # 現在駅
        station_idx = routes['stations'][-1]
        # 近隣駅(選択済み駅は除く)
        neighbors = [ {'station': indices[station_idx][i], 'distance': distances[station_idx][i] } \
                for i in filter(lambda x: indices[station_idx][x] not in routes['stations'], range(0, 5)) ]
        # 最寄り2駅を取得
        for idx in range(0, np.fmin(2, len(neighbors))):
            cp = copy.deepcopy(routes)
            cp['stations'].append(neighbors[idx]['station'])
            cp['distance'] += neighbors[idx]['distance']
            choose_station(cp)

# 15(渋谷)を起点に実行
choose_station({ 'stations': [15], 'distance': 0. })

# 結果表示
pd.DataFrame(results).sort('distance', inplace=False).head(3)
  #=> 0    0.019196  [15, 14, 13, 12, 11, 10, 9, 8, 7, 6, 5, 4, 3, 2, 1, 0]
  #=> 28   0.020719  [15, 14, 13, 12, 11, 10, 9, 7, 8, 6, 5, 4, 3, 2, 1, 0]
  #=> 129  0.021022  [15, 14, 13, 11, 12, 10, 9, 8, 7, 6, 5, 4, 3, 2, 1, 0]
元々、正しい結果が15〜0に並んでいたので、先頭に正しい結果が来ていることがわかる。
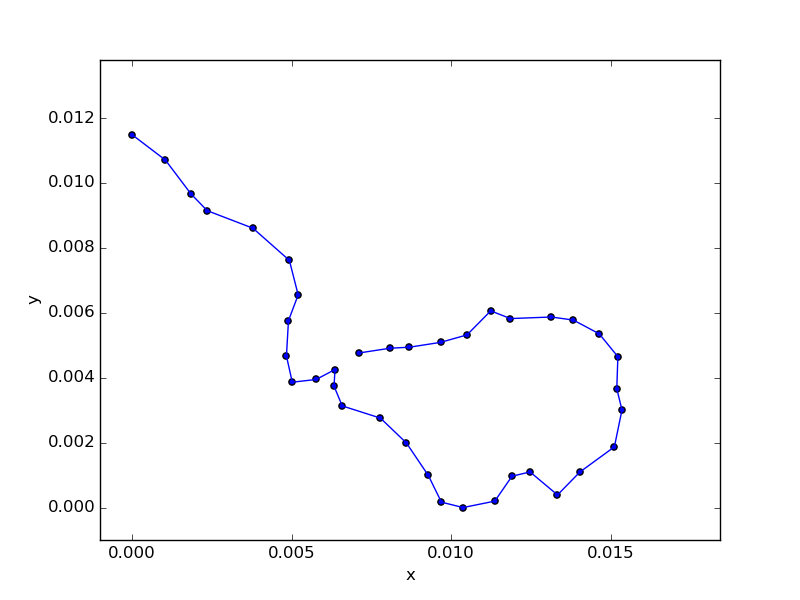
念の為、line plotして正しい結果であることを確認する。
# 正解データ
route = pd.DataFrame(results).sort('distance', inplace=False).reset_index().loc[0]

# plot
ax = target.plot(kind='scatter', x='x', y='y')
for i in range(0, len(route['stations']) - 1):
    target.ix[[route.stations[i], route.stations[i + 1]]][['x', 'y']].plot( \
            kind='line', x='x', y='y', ax=ax, legend=False, xlim=[0.0, 0.010], ylim=[0, 0.016], color='blue')
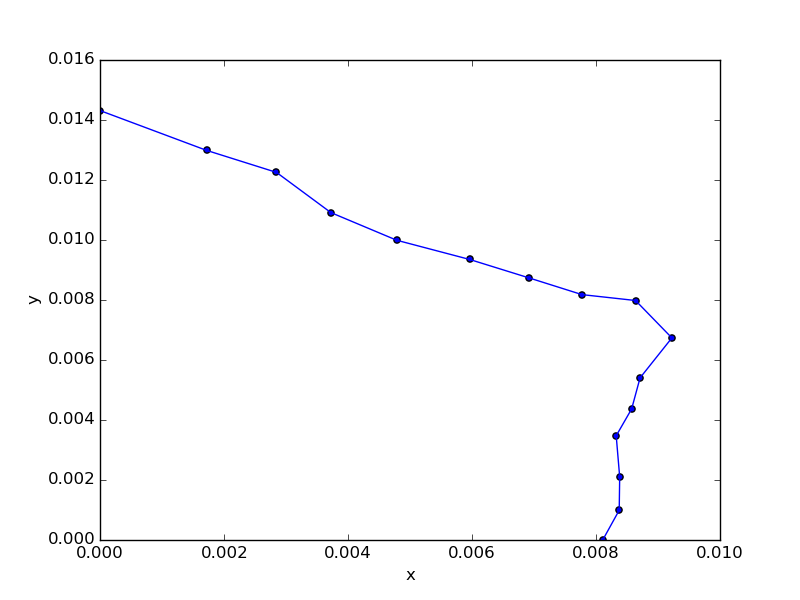
推測したルートを順に線で繋いだ結果、正しそうな並びになった。
京急本線の経路を解く
最後に少し手強そうな京急本線を解く。全50駅。
target =  stations[stations.line_name == '京急本線'].copy().reset_index()
target['x'] = (target.lon - target.lon.min()) * (0.111 * np.cos(target.lat.mean() * np.pi / 180))
target['y'] = (target.lat - target.lat.min()) * 0.111
target.plot(kind='scatter', x='x', y='y')

曲がりくねっていて取り違えそうな箇所がいくつか。そして50駅あるので、先ほどのようにすべての駅で2パターンずつ取ると2の50乗。ゴリ押しはしたくない数になってきた。
連結する路線を機械学習的に判別するとかした方が良さそうだけど、正解データ集めるの面倒なので、とりあえず最も近い駅の2倍以内の距離であることを抽出条件とし、プラスして類似の方角の場合は遠い方を足切りするようにする。
そうすれば大半の駅で紐づく駅は1つに絞られ、いくつかの駅で分岐するのみになる。
類似の方角をどう判定するかだけど、cosine類似度で0.1以下とかにしてみるか。もっと良い判別方法はいろいろありそうだけど。
def similar_direction( start, v1, v2 ):
    return sp.spatial.distance.cosine( v1 - start, v2 - start ) > 0.1
これを元にざらっと書いてみると、こんな記述になった。
# 方角が似ているか確認
def similar_direction( start, v1, v2 ):
    return sp.spatial.distance.cosine( v1[['x', 'y']] - start[['x', 'y']], v2[['x', 'y']] - start[['x', 'y']] ) < 0.1

# k近傍法/ユークリッド距離で用意
from sklearn.neighbors import NearestNeighbors
nbrs = NearestNeighbors( n_neighbors=50, algorithm='kd_tree', metric='euclidean' ).fit( target[['x', 'y']].values )
distances, indices = nbrs.kneighbors( target[['x', 'y']].values )

import copy
results = []
def choose_station(routes):
    if len(routes['stations']) >= len(target):
        distance = sum( map(lambda x: routes['distance'], routes))
        results.append(routes)
    else:
        # 現在駅
        station_idx = routes['stations'][-1]
        current = target.loc[station_idx]
        # 近隣駅(選択済み駅は除く)
        neighbors = [ {'station': indices[station_idx][i], 'distance': distances[station_idx][i] } \
                for i in filter(lambda x: indices[station_idx][x] not in routes['stations'], range(0, 50)) ]
        # 最寄駅を取得
        nearest = neighbors[0]
        nearest_series = target.loc[nearest['station']]
        # distanceが最寄りの2倍以下の駅のみ抽出
        dist_threshold = nearest['distance'] * 2
        neighbors = filter(lambda x: x['distance'] < dist_threshold, neighbors)
        # 最も近い駅と同一方向は除外
        neighbors = filter(lambda x: not similar_direction(current, nearest_series, target.loc[x['station']]), neighbors)
        neighbors = [nearest] + list(neighbors)
        # 同一方向の駅を除外しつつ再帰
        for idx in range(0, len(neighbors)):
            cp = copy.deepcopy(routes)
            cp['stations'].append(neighbors[idx]['station'])
            cp['distance'] += neighbors[idx]['distance']
            choose_station(cp)

# 泉岳寺を起点として探索スタート
choose_station({ 'stations': [0], 'distance': 0. })
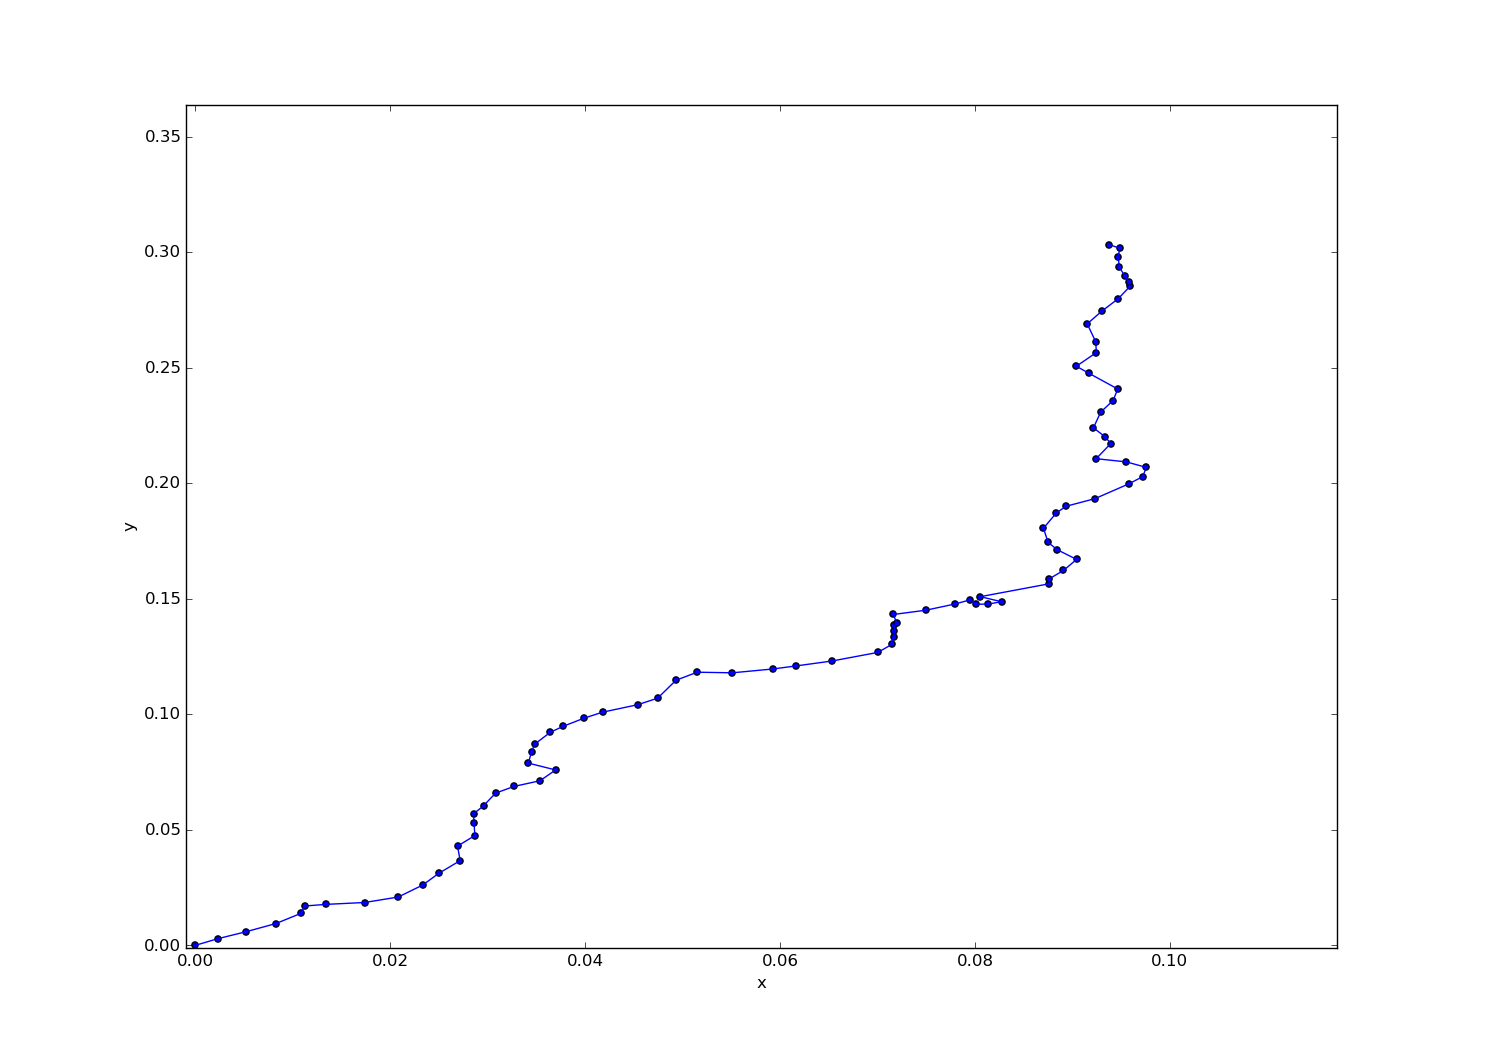
結果として、75パターンが探索された。今まで数万パターンを追いかけていたのと比べるとだいぶ短縮できている。最短の経路をplotするとこうなる。
route = pd.DataFrame(results).sort('distance', inplace=False).reset_index().loc[0]
ax = target.plot(kind='scatter', x='x', y='y')
for i in range(0, len(route['stations']) - 1):
        target.ix[[route.stations[i], route.stations[i + 1]]][['x', 'y']].plot( \
                kind='line', x='x', y='y', ax=ax, legend=False, xlim=[-0.01, 0.02], ylim=[-0.01, 0.06], color='blue')
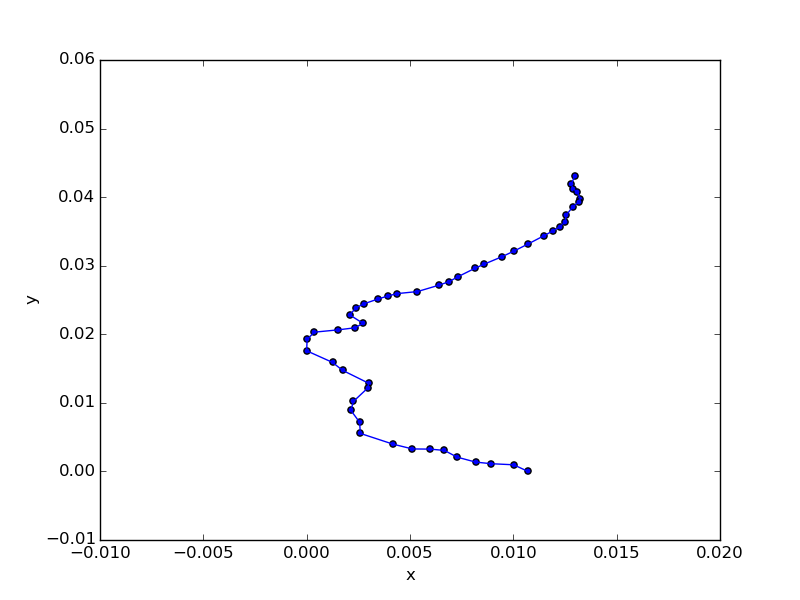
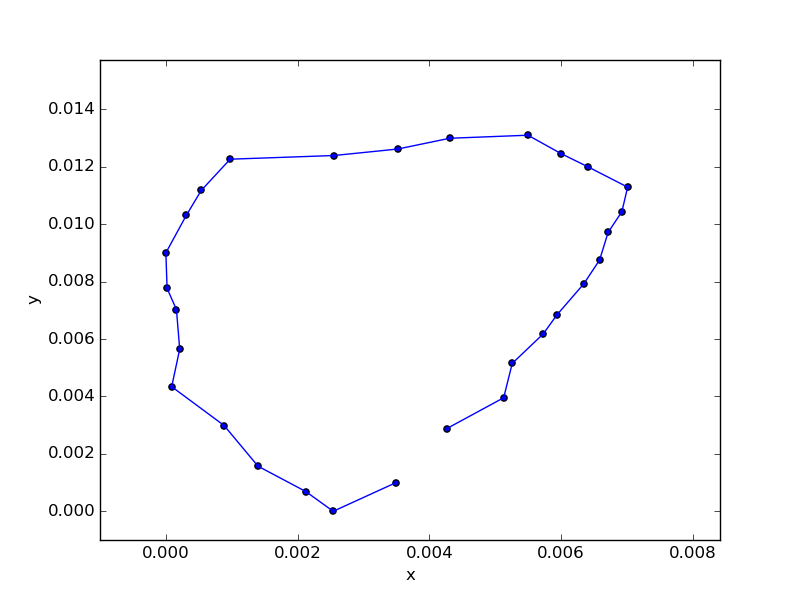
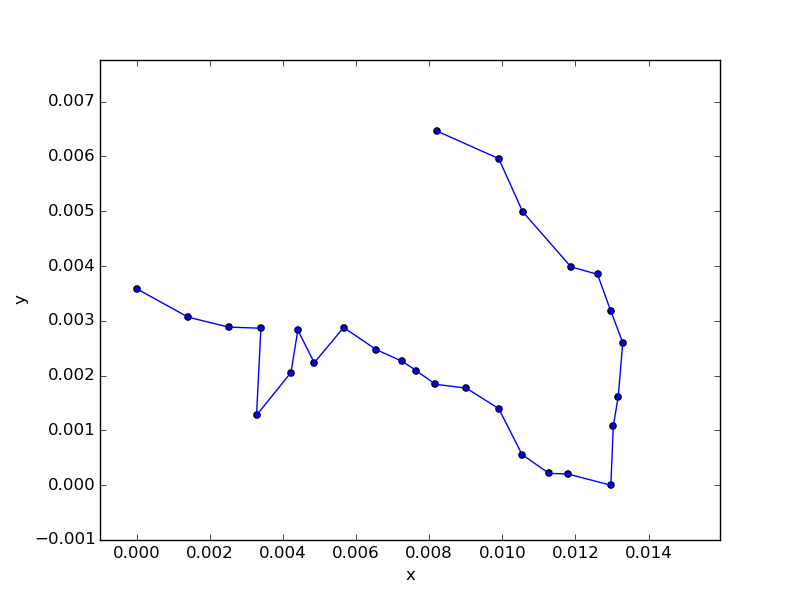
上記が正解。2番めに近いパターンはこうなる。

ぱっと見ではわかりづらいが、左端のところで順序がねじれている。具体的には井土ヶ谷と弘明寺の順が逆になっている。
他の路線でも試してみる
これで概ねすべての路線を出せるようになったと思われるので、いろんな路線を出してみる。とりあえず山手線。品川を始発とする。作り上、同一の駅を2度は通らないので、品川から渋谷方面へ向かい、一周して田町で終了している。
一番駅数の多いJR東北本線(黒磯~利府・盛岡)を実行してみる。途中、中央右寄りのところに結び目っぽいのができてしまって失敗したかと思ったけど、調べてみたら岩切駅のところで路線が二股に分かれているせいだった。
大江戸線について。解けないような気がしていたけど、光が丘を始点にすれば解けるような気がしたのでやってみたところ、都庁前のところが繋がらないのは仕様として、それ以外については割とちゃんとできた。
途中で二股に分かれている丸ノ内線は、こんな風に経路を予測した。歪だけど仕方がない。
まとめ
適当だけどそれなりに少ない計算量で路線の経路が予測できることがわかった。そして枝分かれしている路線はいかんともしがたいこともわかった。
枝分かれは意外と多くの路線で存在しているので、これを使って路線の経路をこれと決めつけることはできないようだ。ただ、誤った経路が設定されている時に検出するくらいのことはできるかもしれない。