SciPyで画像処理
概要
実践 コンピュータビジョンを読んで、出てきたサンプルコードを試したりいじったりする企画、その1-4。
SciPyを利用した画像処理。画像の表示にはMatplotlibを利用。Photoshopがやるような加工をSciPyの機能で実行することができる。
@Versions python3.4, scipy0.17
画像の読み込みと表示
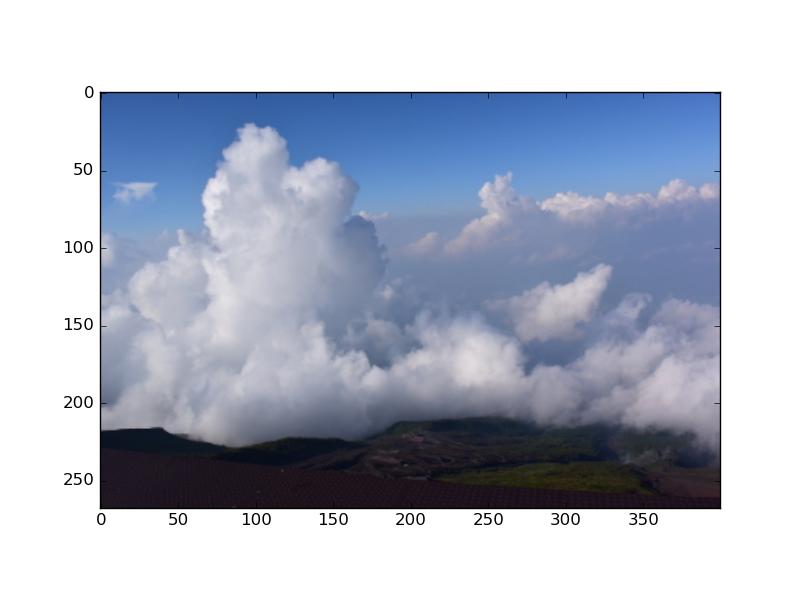
foo.jpgという名前で適当な画像ファイルを置いておく。
# 必要なものをimport
from PIL import Image
import numpy as np
from matplotlib import pylab as plt

# 画像の読み込み
img = np.array( Image.open('foo.jpg') )

# 画像の表示
plt.imshow( img )
ガウシアンフィルタ
SciPyにはndimageという画像処理用のモジュールが用意されているらしい。中にはgaussian_filter, fourier_gaussian, percentile_filter, geometric_transform等、なんか面白そうな機能が用意されている。
とりあえずガウシアンフィルタを使ってみる。
from scipy import ndimage
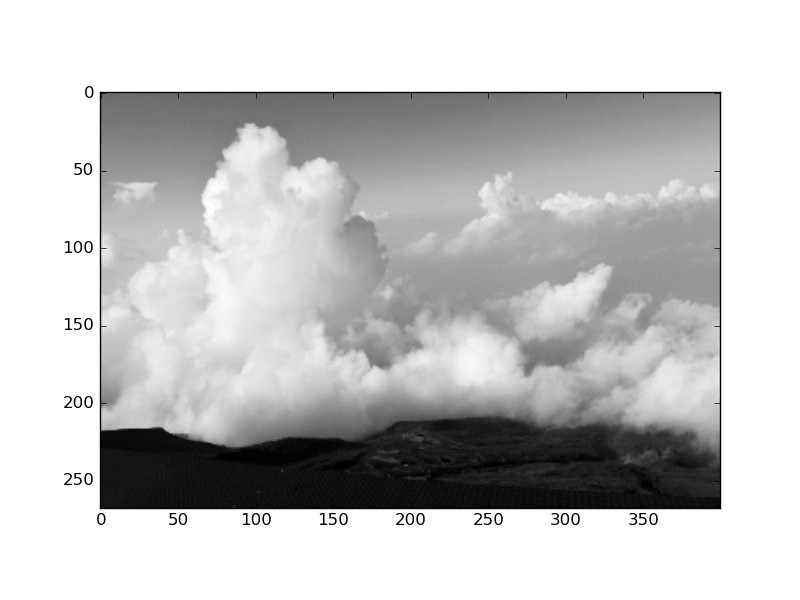
img = np.array(Image.open('foo.jpg').convert('L'), 'f')
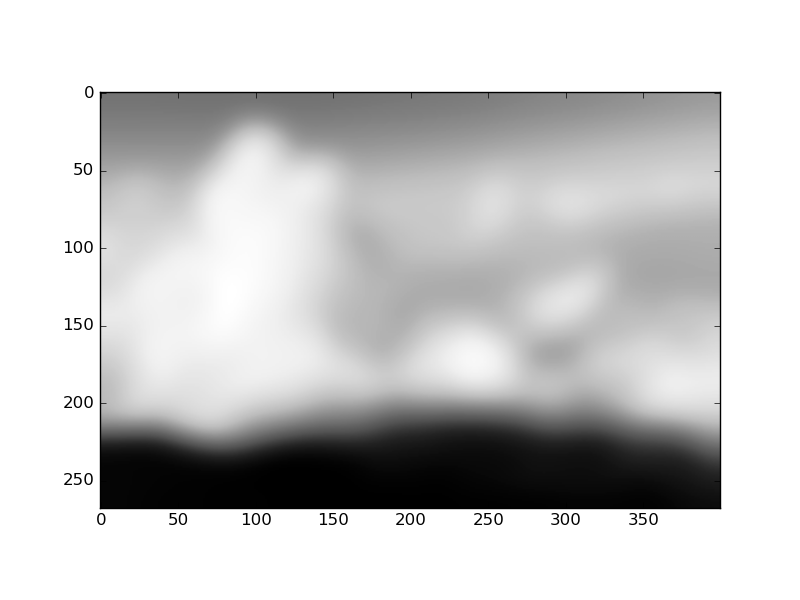
img2 = ndimage.filters.gaussian_filter(img, 3)
plt.imshow(img2, cmap='Greys_r')
元画像
フィルタ後

だいぶボケ(平滑化され)ていることがわかる。2つめの引数(3を渡しているところ)は標準偏差で、これを大きくするとよりボケる。
下記はsigma=10の場合。
ガウシアン微分
gaussian_filterの機能を使って輪郭抽出をすることもできるそうな。
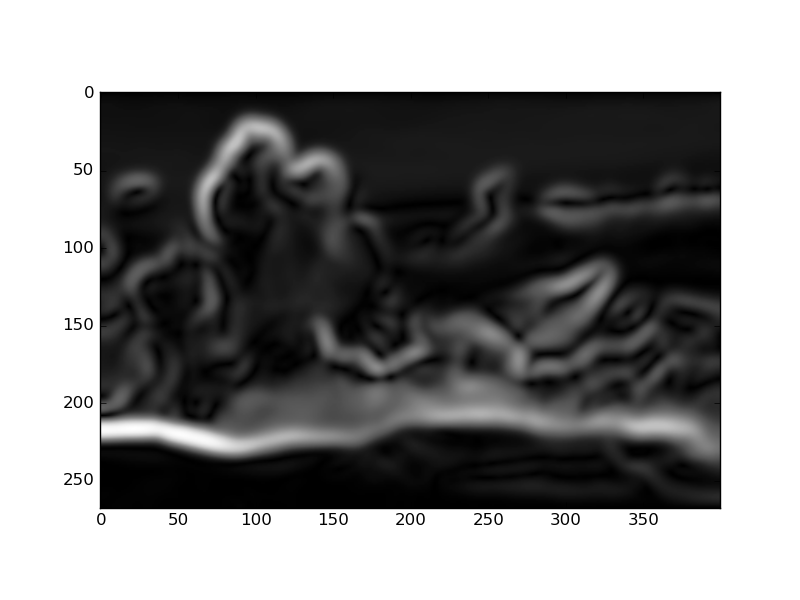
# X方向の微分
img_x = ndimage.filters.gaussian_filter(img, (5, 5), (0, 1))
# Y方向の微分
img_y = ndimage.filters.gaussian_filter(img, (5, 5), (1, 0))
# hypotで合成
img_xy = np.hypot(img_x, img_y)

plt.imshow(img_xy, cmap='Greys_r')
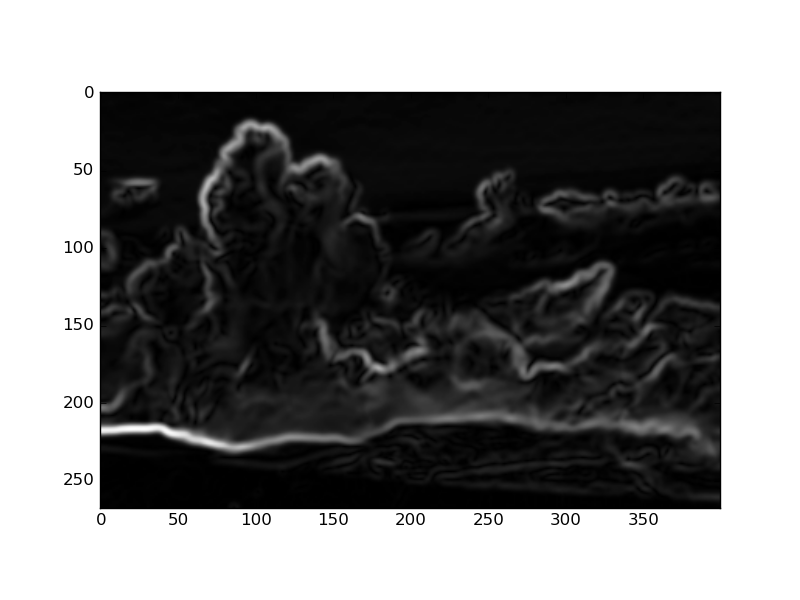
ここのEdge detectionの項だと、gaussian_filterをかけて平滑化してからsobelを使って輪郭を抽出している。
# ガウシアンフィルタ
img2 = ndimage.filters.gaussian_filter(img, 5)
# sobel微分
img_x = ndimage.filters.sobel(img2, axis=0)
img_y = ndimage.filters.sobel(img2, axis=1)
# hypotで合成
img_xy = np.hypot(img_x, img_y)

plt.imshow(img_xy, cmap='Greys_r')
物体の数を数える
Morphologyの機能を使って物体の数を数えることができるらしい。
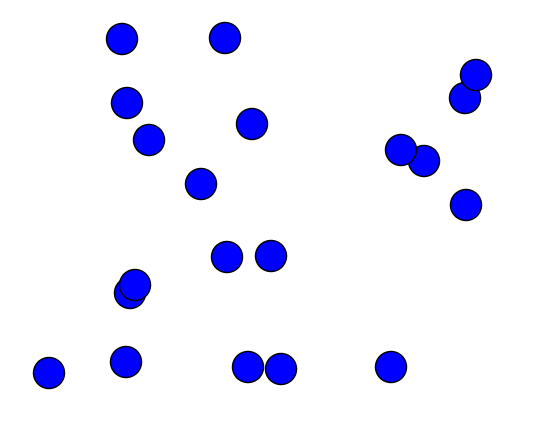
わかりやすい画像として、20個の点がある散布図を用意する。
import matplotlib.pylab as plt
plt.scatter( np.random.random(20), np.random.random(20), s=200 )
これを数えるには、scipy.ndimage.morphology.binary_openingを使えば良いらしい。binary_openingは二値化された配列に対して物体を分離してくれるらしい。
img = np.array(Image.open('foo.png').convert('L'), 'f')

# 二値化する
img = 1 * (img < 128)
# 10×10くらいのstructureを指定して物体を取り出す
im_open = ndimage.binary_opening(img, np.ones((10, 10)), iterations=2)
plt.imshow(im_open, cmap='Greys_r')
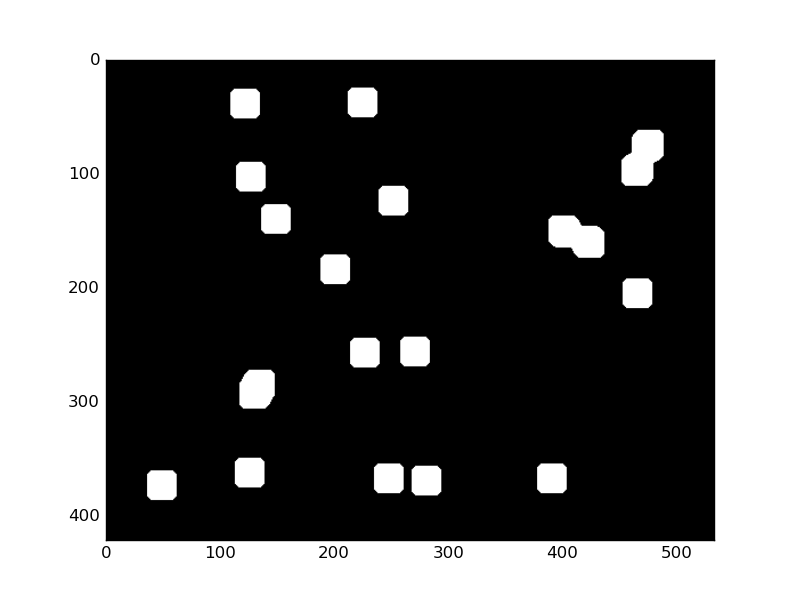
なるほど、こうやって取り出せるのか。面白い。物体のサイズ的にこれを30×30とかで指定すると何も抽出できずに真っ黒になる。
これにscipy.ndimage.labelで各物体にラベルを付ける。
label, num_features = ndimage.measurements.label(im_open)
num_features
  #=> 17
20個の物体をplotしたけど、3個ほど繋がった状態になっているので17とカウントされた。